tag:muhia.posthaven.com,2013:/posts Brian Muhia 2023-05-04T10:05:16Z Brian Muhia tag:muhia.posthaven.com,2013:Post/1907808 2022-11-23T23:12:16Z 2023-05-04T10:05:16Z Alignment Jam #2

On November 11-13, I was in a hackathon! I learned so much that weekend, including how to speedrun a tutorial and how to quickly execute on a research question. I'll be more keen to form or join a team next time, which should help get more done. Here's the link to my results: 

- https://poppingtonic.itch.io/ob

- https://github.com/poppingtonic/transformer-visualization

]]>
Brian Muhia
tag:muhia.posthaven.com,2013:Post/1907806 2022-11-23T23:08:59Z 2022-11-23T23:39:20Z Visualising Multi-Sensor Predictions from a Rice Disease Classifier

Cross-posted from https://zindi.africa/discussions/14258


Introduction

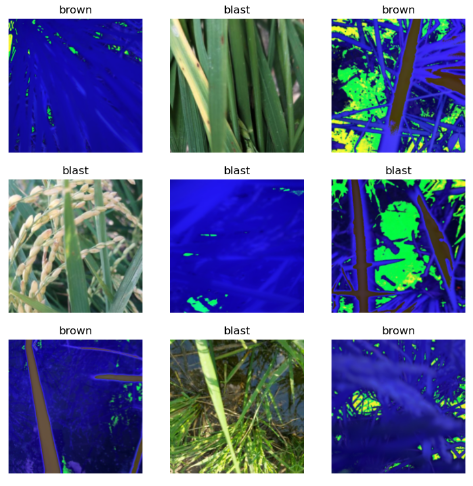
The Microsoft Rice Disease Classification Challenge introduced a dataset comprising RGB and RGNiR (RG-Near-infra-Red) images. This second image type increased the difficulty of the challenge such that all of the winning models worked with RGB only. In this challenge we applied a res2next50 encoder that was first pre-trained with self-supervised learning through the SwAV algorithm, to represent each RGB and their corresponding RGNIR images with the same weights. The encoder was then fine-tuned and self-distilled to classify the images which produced a public test set score of 0.228678639, and a private score of 0.183386940. K-fold cross-validation was not used for this challenge result. To better understand the impact of self-supervised pre-training on the problem of classifying each image type, we apply t-distributed Stochastic Neighbour Embedding (t-SNE) on the logits (predictions before applying softmax). We show how this method graphically provides some of the value of a confusion matrix, by locating some incorrect predictions. We then render the visualisation by overlaying the raw images in each data point, and note that to this model, the RGNIR images do not appear to be inherently more difficult to categorise. We make no comparisons through sweeps, RGB-only models or RGNIR-only models. This is left to future work.

Goal of this Report

This report tries to explain a simple-to-understand method for visualising the distribution of raw predictions from a vision classifier on a random sample of data in the validation set.

We do this to, at a glance;

  1. explain the model in ways that can help us improve it. 

  2. to understand the data itself, asking the question, if the model struggled to classify RGNIR images more than RGB images.


Data

Combining data from multiple sensors seems to be a good way to increase the number of training set examples, which has a known positive effect on train/test performance, among other measures of generalisation. Additional sensors are often deployed to capture different features from the baseline sensors, which may help to resolve their deficiencies. Less well studied is the question of when the additional sensor(s) add noise or require more representational capacity from the model, whether this reduces its capacity to perform the task on even the baseline sensor data.

Methods & Analysis

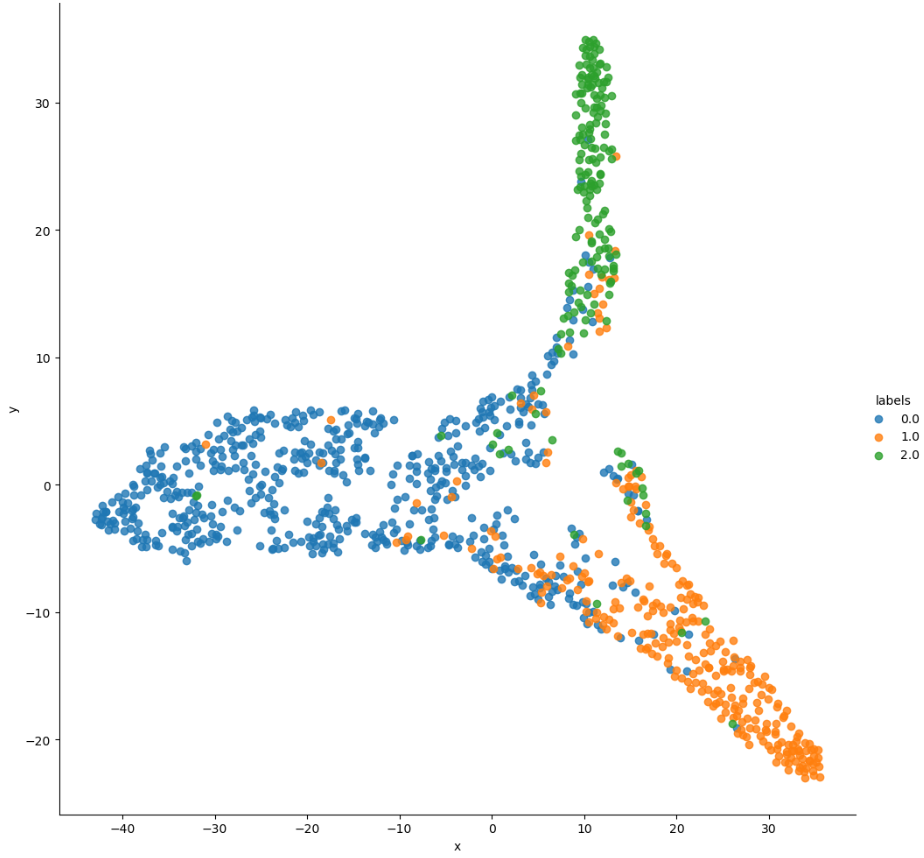
This work is an example of post-hoc interpretability, which addresses the black-box nature of our models, where we do not have access to their internal representations, or ignore the structure of the model whose behaviour we are trying to explain. This means that we only use raw predictions and labels (0.0 = blast, 1.0 = brown, 2.0 = healthy) on each data point, ignoring the model’s layer structure, learned features, dimensionality, weights and biases. This lets us use general methods for clustering data such as t-SNE. To plot a 2D image, we initialise using PCA to reduce dimensionality to 2 components, and apply perplexity=50. Note the overlaps i.e the presence of false-positives in each class, indicating the need for k-fold cross-validation.A T-SNE plot of raw predictions vs labels on a sample from the validation set Note the presence of overlaps which indicates false-positives in each class like a qualitative version of the confusion matrix Legend 00  blast 10  brown 20  healthy


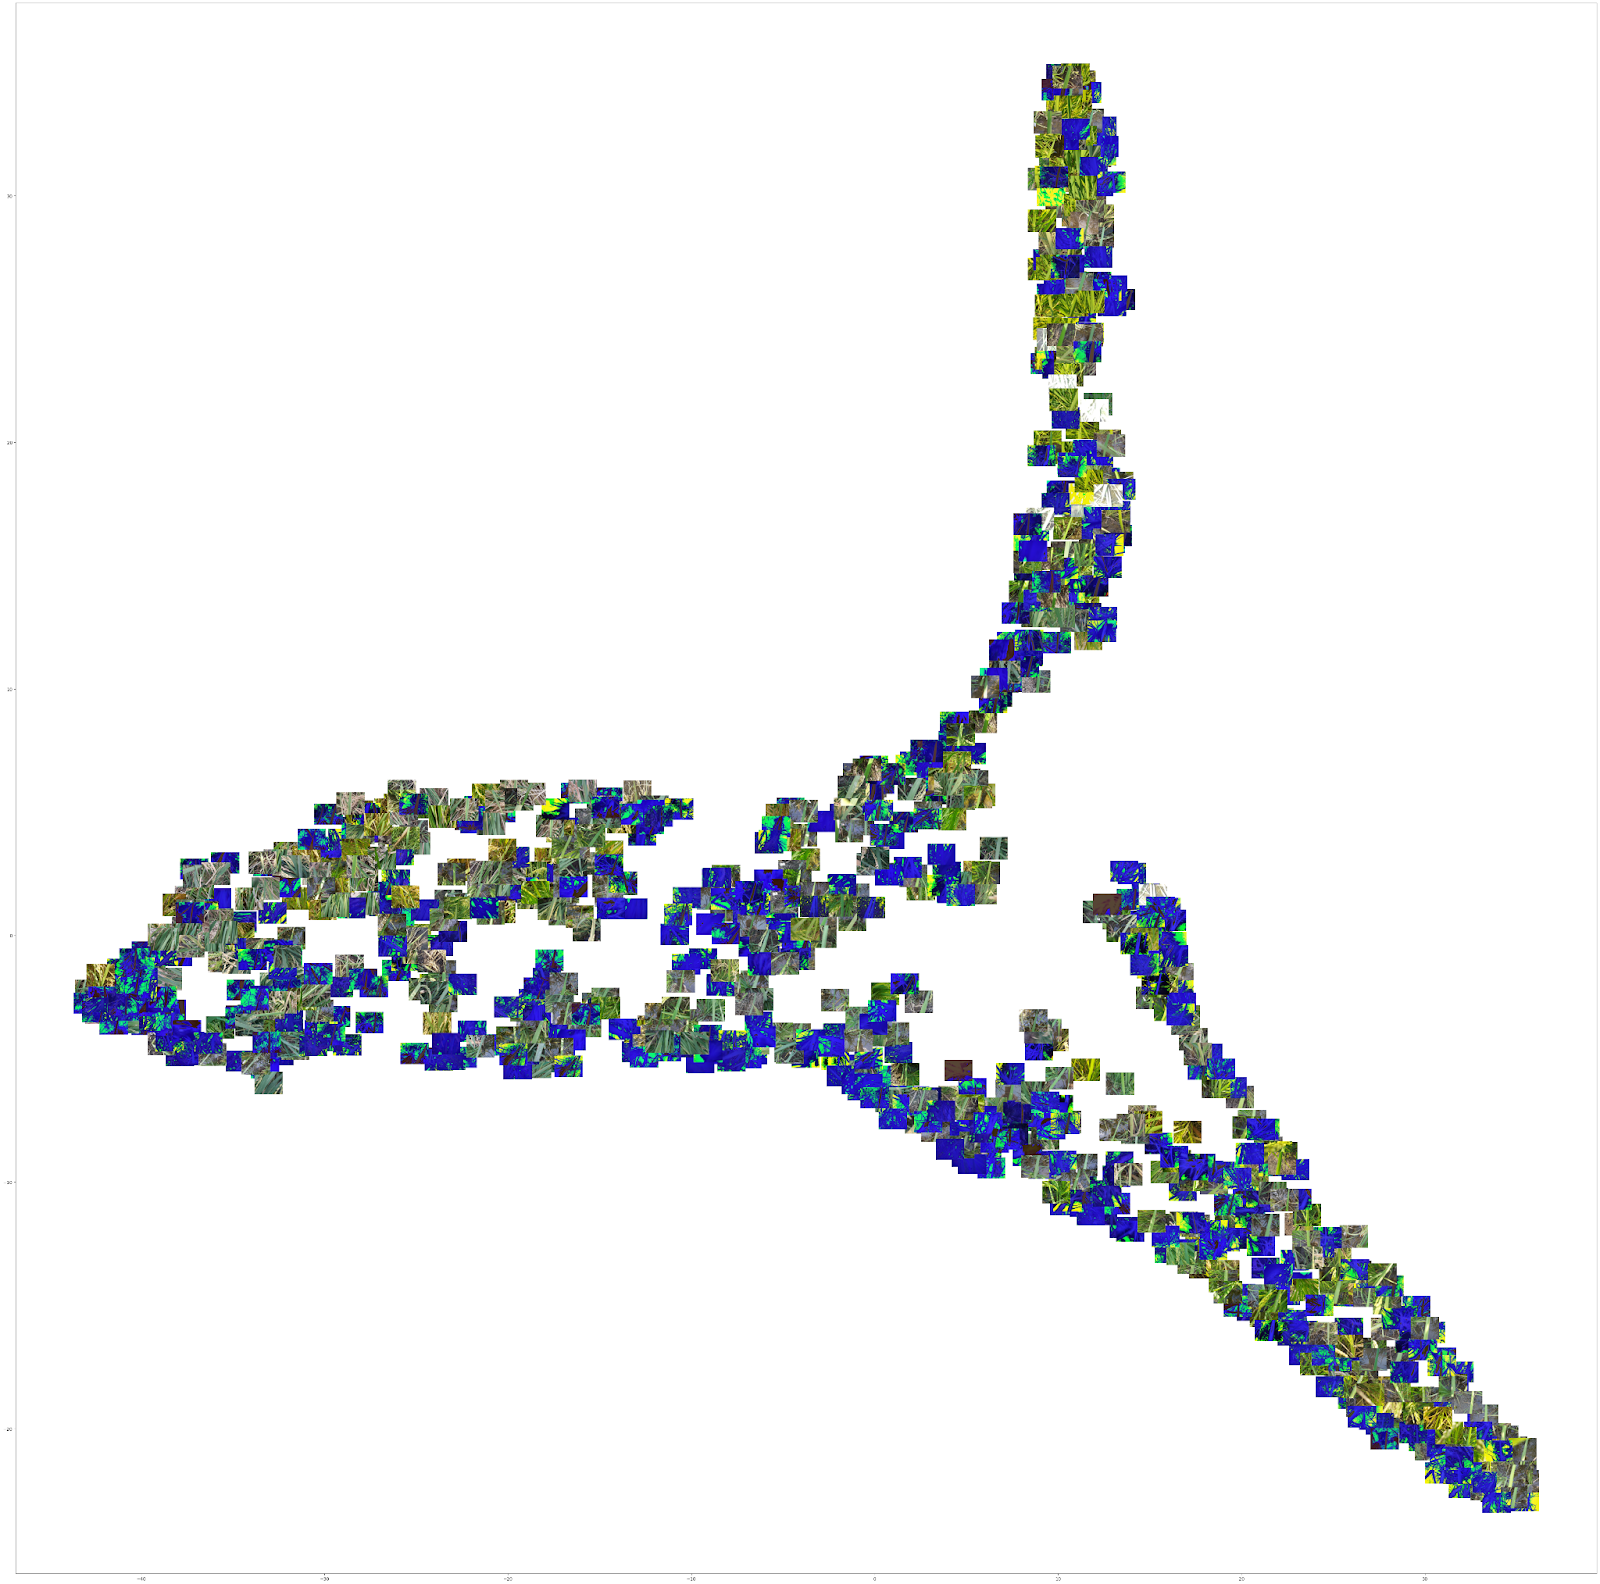
To show the effect that the image type had on classification, we overlay each datapoint with the raw image it represents. This follows from related work by Karpathy and Iwana et. al which use this methodology to produce informative visualisations with some explanatory value, although in this case the effect is more salient due to the two image types. We see where the RGNIR images tend to cluster in relation to their location in the global cluster regions in the chart above. Note the density of RGNIR images in the “tip” of the “blast” cluster (blue region in the first plot, scroll up then back), and in the bottom middle, indicating that while some RGNIR images were easy to correctly classify as “blast”, others were more easily confused with “brown” than they were with “healthy”. Qualitatively, there appear to be more false-positive RGNIR images than not, which might indicate higher uncertainty or noise in the predictions due to conflicting sensor data. This might be an artefact of the data augmentation methods used to train SwAV and the classifier. A lot more region-overlapping in the centroid of the image, together with the presence of both image types indicates some confusion for the classification task. 


There are many reasons not to put much weight on the analysis above. T-SNE is valuable only after multiple runs have been observed. We might also want to include comparisons with weights from different epochs, early in training. More generally, statistical grounding improves the quality of good interpretability methods. In conclusion, the separation could be improved by applying readily available methods and there is no a priori reason to expect the pretraining strategy to contribute to better separation of classes. It helps with representing the images more fairly, but not decisively for the classification problem. All this work can be reproduced with the notebooks available here. The repository also has links to model weights: Rice Disease Classification through Self-Supervised Pre-training.


Conclusion

We show that when correctly applied, t-SNE, or potentially other types of dimensionality reduction methods can produce plots that can help us understand which of our training strategies could be changed in order to improve the model’s test set scores. In this case, we identify cross-validation as a potential intervention. We also learn more about our data using a method that is reproducible and reusable for other domains.

Acknowledgments

Kerem Turgutlu for self-supervised: https://keremturgutlu.github.io/self_supervised

Zachary Mueller: https://walkwithfastai.com

Jeremy Howard: https://fast.ai

Daniel Gitu, Ben Mainye and Alfred Ongere for helping proofread a draft of this document.

Open Philanthropy for funding part of this work.


Appendix

  1. 1: Self-Distillation

When training a classifier, we eventually find predictions that are correct with high confidence. Naively applied, self-distillation in this case meant assigning labels to high-confidence test set examples. We collect these new labels and create a new “train.csv” which is used to fine-tune the best checkpoint with the dataset updated to include resampled test set examples, with their predicted labels. The final private test set predictions were produced after 2 rounds of self-distillation.

  1. 2: t-SNE

t-SNE is a dimensionality reduction method useful for producing beautiful visualisations of high dimensional data. It gives each high-dimensional data point a location on a 2D or 3D map. This relies on the parameter n_components, which we set to 2 for a 2-dimensional image. t-SNE is a non-linear, and adaptive transformation, operating on each data point based on a balance between its neighbours (local information) and the whole sample dataset (global information). For this, the hyperparameter ‘perplexity’ is applied. We set this to 50 in the presented plot, after sampling values below that (2, 10, 30), and above (100) to observe the different plots that are generated.


]]>
Brian Muhia
tag:muhia.posthaven.com,2013:Post/1853341 2022-07-10T15:04:20Z 2022-07-10T15:04:20Z Boo "Paperclip Maximizers" as a term

This is an analogy used in informal arguments related to AI's potential for catastrophic risk. The value of the analogy in this name was, in my view, that it pointed out the idea of "a random outcome that nobody asked for". Paperclips are what you'd call a niche interest, for humans nearly everywhere in the past or future. So an incredibly powerful computer that somehow managed to maximize the number of paperclips on earth over everything else, against the wishes of its controllers, would produce a random outcome that nobody asked for, especially those who don't care one bit about paperclips.

]]>
Brian Muhia
tag:muhia.posthaven.com,2013:Post/1785967 2022-01-29T11:57:43Z 2022-01-29T11:57:43Z Difficult Vision Challenges: Uchida Lab's Book Dataset

As someone who wants to interpret and explain decisions from deep learning models, I like to highlight difficult datasets as a subject for study. My current challenge is Iwana et. al’s “Judging a Book By its Cover”, which introduced a 200k+ image multi-feature dataset of book covers from Amazon. The paper posed a genre classification challenge. The original tasks are very challenging for a convolutional neural network to tackle. My own attempts with a resnet-50 fine-tuned from ImageNet only slightly beat the published top result, with 0.306 top-1 accuracy. Training procedure was SGD with warm restarts, discriminative fine-tuning, cyclical learning rate decay schedule, progressive image resizing and data augmentation at test time.

This is a T-SNE visualisation of my model’s test set performance on a sample of the dataset:

The spikes represent 30% of the images, with 70% in the centroid, underrepresented for their label. T-SNE ran with perplexity=15.

The visualisation suggests that relying on the convolutional inductive bias only works for a small number of naturalistic covers represented in the dataset (the spikes in the image), but fails to find any genre-unique similarity between most varieties of plain human-designed text, fonts and graphic design. It might also be due to different forms of imbalance in the dataset. This visualisation and theory is worth more exploration. Testing multimodal models with a Text+Vision inductive bias on this dataset might shed some light on this. For example, evaluating and visualising contrastive language-image pretraining (CLIP) in inference mode. The CLIP paper claims that it can do OCR. Can it classify the recognized text as well? Here we would evaluate CLIP’s zero-shot performance based on the task of classifying the text in the book cover image by genre. The task would be: each image would have a question asking "Is this a picture of a <genre>?" 

There's an interpretability project here, which would be to visualise multimodal embeddings activated by this task and use that to explain why it works better, if it does. This would be one entry point for work on visualising and explaining large language models because it often feels like visualisation is simpler with multimodal tasks.


]]>
Brian Muhia
tag:muhia.posthaven.com,2013:Post/1407094 2019-05-09T14:12:39Z 2019-05-09T14:39:46Z Machine Learning Updates and Links (May 2019)

1. I recently taught AI Saturdays Nairobi about DEViSE (Deep visual-semantic embedding) methods, which can be useful in visual image search, dataset curation, semantic image search, and [possibly] blocking movie spoilers you'd rather not see..? Notebook is available here: devise-food101-v2.ipynb.

2. In April, I participated in the inaugural AI4D (AI for Development) network of excellence in Artificial Intelligence for Sub-Saharan Africa. See updates from the event here: AI4D-SSA.

3. Sign up to participate in the Omdena AI Challenge! See the details here: Omdena AI Challenge.

4. Nairobi Women in Machine Learning and Data Science is holding an event in June to encourage people to contribute to critical infra in ML. This time it's scikit-learn: Scikit-Learn Sprint (contribute to open source).

]]>
Brian Muhia
tag:muhia.posthaven.com,2013:Post/1380225 2019-03-01T22:09:35Z 2019-03-01T22:36:57Z Engineering Scientific Serendipity

Space expands. We know this from our study of general relativity and cosmology. I think an alternate phrasing is also correct. Noting that there is more than one kind of space, one might say: spaces expand. Whatever space it is of, independently of every other, it has a dimension, or more accurately, one or more degrees of freedom, to expand into, which sometimes interact with other spaces' degrees of freedom. We just have to be observant of it and grow harmoniously into the expanded spaces.

To scientists of all callings, the problems they encounter may seem extremely hard before their questions are phrased correctly, while their solutions often have multidimensional uses outside the scientific invention's contexts. Who would have predicted that Einstein's general relativity would have been used to make GPS? Certainly not Einstein himself.

Our engineering skills lived up to the serendipity offered by Einstein's discovery. This is what I loved about watching Edward Boyden's talk about Engineering Serendipity, which I embed here. Please watch it.

The 20th Century's foundational inventions and discoveries were mostly in sociology, computation, mathematics, physics, biology and chemistry. This is not an exhaustive list. Astrobiology and geology are in this list as well.

So now our use cases for these inventions, probably completely unprecedented from that point of view, are in figuring out geography, climate, energy and personal space.

A non-exhaustive unordered list of our future's subjects of study, and my predictions for their uses:


Geography for living space.

Climate for the food, water, the cool breeze and breathing space for all life.

Energy to unlock the productivity space for every one on earth. See Eric Drexler's The Antiparallel Structure of Science and Engineering, and Exploratory Engineering for a discussion of this. He talked about this 7 years ago at the Future of Humanity Institute' inauguration of their program on the impact of future technology:

Biology for the freedom to expand the space for personal growth, by investing in longevity research and development.

Art for the expansion of the space of meaningful conversations.

]]>
Brian Muhia
tag:muhia.posthaven.com,2013:Post/1361916 2019-01-10T14:11:57Z 2019-08-20T20:45:32Z COCOHub: A crowdsourced dataset builder and community for NLP in underrepresented languages

Because it is so hard to find appropriately structured datasets when learning/researching NLP (specifically machine translation and image captioning) for underrepresented languages, I decided to create a crowdsourced site that translates MS-COCO 2015 to create two kinds of dataset:

1. Machine translation for any two languages in COCOHub. This language list is an open, append-only list of language projects that can be added to as long as someone asks for it.

2. Image captioning. This is very useful from an education and accessibility point of view. Without regard for whether the datasets themselves will be sufficient to completely solve the task, they will certainly be necessary, to begin with.

Goals: to create a collection of open datasets offering novel language pairs for machine translation, captions for images, and using existing open source infrastructure to support the evaluation of competitions that advance SoTA in both translation and image captioning for underrepresented languages.

The beneficiaries of this project include students and researchers first, then end users who will eventually get translators and image captioning systems working for their local languages.

1. Image captioning

The MS-COCO 2015 Image Captioning challenge published nearly one million sentences, with five sentences attached to each of around 330,000 images. Being an image captioning dataset, translating it automatically gives us captions in the underrepresented languages that we select. Each language is its own project, managed by a team of verifiers and champions, feeding a data pipeline that publishes the same data structure as the original, except in each of the target languages. Each image ID has 5 sentences independently provided by professionals (see paper). At the end of it all, there will be a simple web page that lets people search for a language and download a compressed JSON file, split into training, validation and test sets, for their language of choice. This opens up image captioning as a competition-level research opportunity for many languages that previously wouldn't have been available. Further, following on the linked paper, an analysis framework can be built, and all data preprocessing tasks required for each language will now have sample data to test with.

2. Machine translation

There will probably be more than 50 language targets in COCOHub. The five independently sourced descriptions attached to each unique image ID will have 5-10 translations contributed, both to mitigate the negative effects of spam, and to find interesting translation variants that can be voted on by the community. The dataset also has unique integer IDs for each sentence, which means that, given a single source (English) sentence, each integer maps to a translation in as many languages as there are volunteers to help complete the project. So the translations aren't just to English - they point to other languages as well. This has nice linguistic properties as it reflects how a lot of Africans think, by code-switching.

COCOHub's crowdsourcing tools will support voting and (eventually) statistical verification, letting people vote on the best of many contributed translations for a single sentence. This will ensure that when a project is completed, i.e. when all the English sentences have been translated to a language and people have spent time voting and verifying, the highest quality sentences get published and used by students and researchers who want to work in those languages. 

A bonus of this approach will be that for each completed language project, there may be another language that would never have been a translation target for it, so people can mix and match languages in very interesting ways. We'll be fundamentally creating the same data structure, just in 50+ different languages. Imagine someone deciding to translate Luhya to Yoruba as a research/study project just because the option is there to play around with.

There are various preprocessing tasks that are needed for the resultant technology to be practically achievable, from Sentencepiece tokenization and lemmatization to web scraping of unstructured documents. Another way to find monolingual corpora is to use the Common Crawl dataset, by writing language detection systems using fastText models that let us extract the relevant sentences from it. It is very computationally expensive as Common Crawl has terabytes of data, so it is important to publish this data as well, in order to help people down the road. One further step is using the scraped data to construct fastText word vectors that provide very useful word-level context for word use. An example of using fastText to bootstrap an English-French translation model - a form of transfer learning for machine translation - is here.


The original MS-COCO captions dataset is released on a Creative Commons 4.0 Attribution license, which gives leeway to make the resultant derivative datasets open by default. This means that there will be a need for a team of verifiers for each language pair, probably professional linguists. University faculty can plug in nicely to this part of the project.

]]>
Brian Muhia